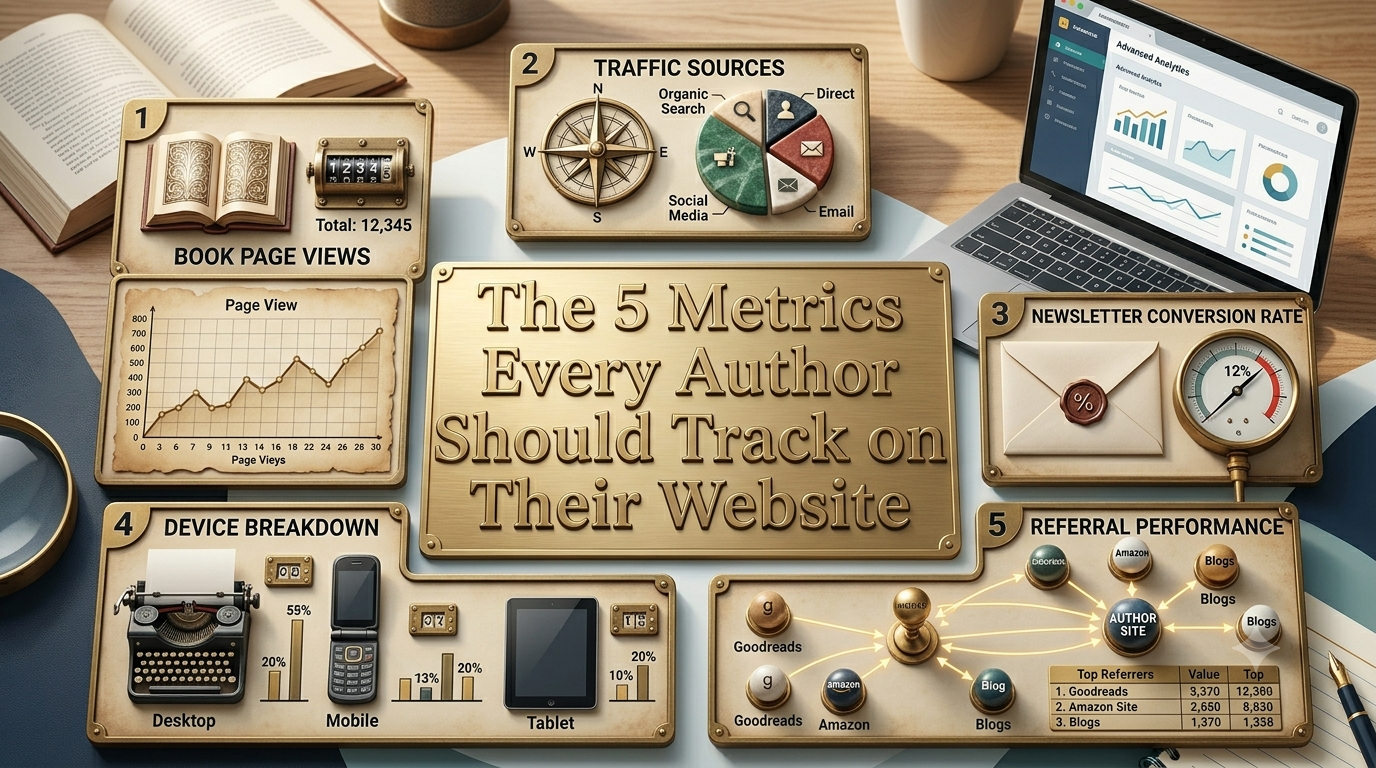
The 5 Metrics Every Author Should Track on Their Website
Stop guessing what works. These five website metrics tell you exactly where to focus your marketing time and budget.
Most indie authors check their Amazon sales rank obsessively but never look at their own website analytics. That's backwards. Your website is the one platform you control — and the data it generates tells you more about your readers than any retailer dashboard.
1. Book Page Views
Which books attract the most attention? If your fantasy novel gets 5x more views than your contemporary fiction, that's your audience telling you what they want. Double down on what works.
2. Traffic Sources
Where do your visitors come from? If 40% of traffic comes from Pinterest and you're spending all your time on Facebook, you're marketing in the wrong place. Follow the data, not your habits.
3. Newsletter Conversion Rate
What percentage of visitors join your email list? If your homepage gets 1,000 visitors but only 5 subscribers, your signup form needs work. If your reader magnet page converts at 30%, create more lead magnets.
4. Device Breakdown
Are your readers on mobile or desktop? If 65% of your traffic is mobile (common for social media referrals), your book pages and checkout need to be flawless on small screens.
5. Referral Performance
When you run a promotion — social post, newsletter blast, affiliate push — did it actually drive traffic? Check your referral data after every campaign. Kill what doesn't work, scale what does.
How Often to Check
Weekly: Quick pulse check — any spikes or drops?
Monthly: Trend analysis — what's growing, what's flat?
After every campaign: Did this specific action drive results?
AuthorLoft includes built-in analytics powered by PostHog — no setup, no code, no extra subscription.
Why Your Website Analytics Matter More Than Your Amazon Dashboard
(A Data‑Driven Guide for Indie Authors)
Most indie authors refresh their Amazon sales rank like it’s a slot machine. They check it in the morning, after lunch, before bed, and sometimes in the middle of the night. They watch the number rise and fall, hoping it will reveal something meaningful about their career.
But here’s the truth:
Your Amazon sales rank tells you almost nothing about your long‑term success.
Your website analytics tell you almost everything.
Your website is the one platform you fully control.
It’s your digital home base — the place where readers discover your books, join your newsletter, buy directly from you, and learn what you’re about.
And unlike retailer dashboards, your website analytics reveal:
What readers want
Where they come from
What they click
What they ignore
What converts
What needs fixing
What’s working
What’s wasting your time
If you want to grow as an author — sustainably, predictably, and strategically — your website analytics are the most valuable data you have.
Let’s break down the five metrics every indie author should track, why they matter, and how to use them to make smarter decisions.
1. Book Page Views: What Readers Actually Care About
Every author has assumptions about which of their books readers like most.
But assumptions are not data.
Your website analytics show you exactly which book pages get the most attention — and that information is gold.
Why Book Page Views Matter
Book page views tell you:
Which books attract the most interest
Which genres your audience prefers
Which covers or blurbs are most compelling
Which books need more visibility
Which books are driving your brand
If your fantasy novel gets 5x more page views than your contemporary fiction, that’s not a coincidence. That’s your audience telling you what they want more of.
How to Interpret the Data
If one book consistently outperforms the others:
Write more in that genre
Promote that series more heavily
Create spin‑offs or companion stories
Build your newsletter magnet around that world
Feature that book more prominently on your homepage
If a book gets very few views:
Reevaluate the cover
Rewrite the blurb
Improve the SEO
Add more internal links
Promote it in your newsletter
Create a stronger hook
Real‑World Example
Let’s say you write both cozy mysteries and paranormal romance.
You assume your cozy mysteries are your main draw because they sell more on Amazon.
But your website analytics show:
Cozy mystery pages: 800 monthly views
Paranormal romance pages: 3,200 monthly views
That’s a massive difference — and it means your paranormal romance audience is bigger, more curious, and more engaged than you realized.
Your website reveals the truth your retailer dashboard hides.
2. Traffic Sources: Where Your Readers Come From
Most authors spend their time on the wrong platforms.
They post endlessly on Facebook even though their readers are on Pinterest.
They tweet daily even though their readers come from Instagram.
They pour energy into TikTok even though their readers come from Google search.
Your traffic sources tell you exactly where your readers are — and where you should focus your marketing time.
Why Traffic Sources Matter
Traffic sources reveal:
Which platforms drive real readers
Which platforms waste your time
Which platforms deserve more attention
Which platforms you can safely ignore
Which platforms convert best
If 40% of your traffic comes from Pinterest but you spend all your time on Facebook, you’re marketing in the wrong place.
How to Interpret the Data
If a platform sends a lot of traffic:
Double down on it
Create more content for it
Optimize your profile
Add more links
Engage more consistently
If a platform sends almost no traffic:
Reduce your time investment
Stop posting daily
Reevaluate your strategy
Consider whether your audience is even there
Real‑World Example
You check your analytics and see:
Pinterest: 42%
Google Search: 28%
Instagram: 12%
Facebook: 4%
Twitter/X: 1%
Yet you’ve been spending:
10 hours/week on Facebook
6 hours/week on Instagram
0 hours/week on Pinterest
Your data is telling you something loud and clear:
Your readers are on Pinterest.
Your habits are on Facebook.
Follow the data — not your habits.
3. Newsletter Conversion Rate: How Well You Capture Readers
Your newsletter is the most valuable asset you own as an author.
It’s your direct line to readers.
It’s your launch engine.
It’s your sales machine.
It’s your long‑term career insurance.
But your newsletter is only as strong as your ability to convert website visitors into subscribers.
Why Newsletter Conversion Rate Matters
Your conversion rate tells you:
How compelling your signup offer is
How effective your homepage is
How well your reader magnet performs
Whether your form placement works
Whether your copy resonates
If your homepage gets 1,000 visitors but only 5 subscribers, something is broken.
What Good Conversion Rates Look Like
Homepage signup: 1–5%
Reader magnet landing page: 20–40%
High‑intent pages (book pages, blog posts): 3–10%
If your reader magnet page converts at 30%, that’s excellent — create more lead magnets like it.
If your homepage converts at 0.5%, it needs:
A stronger headline
A clearer offer
A more prominent form
A better reader magnet
Fewer distractions
Real‑World Example
Your analytics show:
Homepage: 1,200 visitors → 6 signups (0.5%)
Reader magnet page: 300 visitors → 90 signups (30%)
This tells you:
Your homepage is underperforming
Your reader magnet is strong
You should drive more traffic to your magnet page
You should redesign your homepage to highlight your magnet
Your conversion rate is the heartbeat of your author business.
4. Device Breakdown: How Readers Experience Your Website
Most authors design their websites on desktop — but most readers visit on mobile.
If your site isn’t optimized for mobile, you’re losing readers before they even see your book.
Why Device Breakdown Matters
Device data tells you:
How readers experience your site
Whether your design works on small screens
Whether your checkout is mobile‑friendly
Whether your book pages are readable
Whether your forms are easy to use
If 65% of your traffic is mobile, your website must be flawless on mobile.
What to Look For
Check your analytics for:
Mobile vs. desktop percentages
Bounce rate by device
Conversion rate by device
Time on page by device
If mobile bounce rate is high, your site likely has:
Tiny text
Hard‑to‑tap buttons
Slow load times
Poor spacing
Broken layouts
Overly complex menus
Real‑World Example
Your analytics show:
65% mobile
30% desktop
5% tablet
But your mobile bounce rate is 78%, while desktop is 32%.
This means:
Mobile users are leaving immediately
Your mobile layout is hurting your conversions
You’re losing the majority of your potential readers
Fixing your mobile experience could double or triple your results.
5. Referral Performance: What Actually Works (and What Doesn’t)
Every time you run a promotion — a social post, a newsletter blast, an affiliate push, a BookTok video — you should check your referral data.
This tells you whether your effort actually drove traffic.
Why Referral Performance Matters
Referral data reveals:
Which campaigns worked
Which campaigns failed
Which affiliates performed
Which social posts drove clicks
Which newsletters converted
Which collaborations were worth it
Without this data, you’re guessing.
How to Use Referral Data
After every campaign, check:
How many visitors came from that source
How long they stayed
What they clicked
Whether they subscribed
Whether they bought
If a campaign drove zero traffic, stop doing it.
If a campaign drove hundreds of visitors, scale it.
Real‑World Example
You run three promotions:
Instagram post
Newsletter mention
Pinterest pin
Your analytics show:
Instagram: 12 visitors
Newsletter: 180 visitors
Pinterest: 420 visitors
This tells you:
Instagram is low‑impact
Your newsletter is strong
Pinterest is your powerhouse
Your future strategy becomes obvious.
How Often Should Authors Check Their Analytics?
You don’t need to obsess over your analytics daily.
But you should check them regularly enough to spot trends and make informed decisions.
Here’s a simple schedule.
Weekly: Quick Pulse Check
Look for:
Sudden spikes
Sudden drops
Broken pages
Traffic anomalies
Unexpected referrals
This takes 5 minutes and keeps you aware of what’s happening.
Monthly: Trend Analysis
This is where the real insights come from.
Look at:
Traffic growth
Book page performance
Conversion rates
Top pages
Top traffic sources
Mobile vs. desktop
Search terms
Referral patterns
Monthly reviews help you adjust your strategy before small problems become big ones.
After Every Campaign: Did It Work?
Every time you:
Post on social
Send a newsletter
Run an ad
Launch a book
Collaborate with an author
Work with an affiliate
Publish a blog post
Check your analytics.
If it worked, scale it.
If it didn’t, stop doing it.
This is how you build a data‑driven author business.
Final Takeaway: Your Website Is Your Most Valuable Asset — Treat It Like One
Amazon sales rank is a vanity metric.
Your website analytics are a growth metric.
Your website tells you:
What readers want
Where they come from
What they click
What they ignore
What converts
What needs fixing
What’s working
What’s wasting your time
If you want to build a sustainable author career — one that grows year after year — your website analytics are the roadmap.
Stop guessing.
Stop hoping.
Stop relying on retailer dashboards.
Your website is the one platform you control.
Your analytics are the truth hiding in plain sight.
Use them.
· Ready to take back control? ·
Own your author business starting today
Keep 100% of every sale and own every reader relationship — no middleman.
Get Started Free